
Auto body shop marketing is anything that puts more of the right cars in your bays at a cost your gross profit can carry. Clicks, impressions and leads are the middle of the story. The score is booked repair orders, the repair revenue behind them, and what each one cost to win. Everything in this guide comes back to that number.
What the work is for
Most shops buy marketing the way it’s sold: a website package, an SEO retainer, an ad budget, a social media plan. Each one reports its own activity, and nobody adds it up into the one question the owner cares about: did it put a car in a bay?
Turn it around. Start with the cars you want more of and the room you have for them, then work backward to the few things that win those cars in your market. Keep score with four numbers:
- Booked ROs, by source.
- Repair revenue from those ROs.
- Gross profit per RO, after parts, labor, paint and materials, and sublet.
- Cost per booked job: what you spent on a channel, divided by the ROs it produced.
If a channel can’t be tied to those numbers, it isn’t measured yet. That doesn’t mean it isn’t working. It means you don’t know.
Measure it in repair orders, or you’re paying for activity.
Where collision work comes from
Every RO in your system came through one of a few doors: an insurer referral or program, a past customer or someone they sent, a driver who searched and chose you, a tow operator, a dealer, a fleet account, or a customer paying out of pocket.
The insurer door is getting busier. CCC’s 2026 Crash Course report found direct repair programs accounted for 46.7% of appraisals by inspection method in 2025, and that repairable claim volume fell 9.7% across all coverages. Total losses hit a record 23.1% of all claims.
Fewer repairable claims, more of them routed by insurers. For an independent shop, that makes the doors you control more valuable every year.
They’re bigger than most owners think. In CCC’s “Moments of Truth” study with Magid (2,400 policyholders, reported in October 2024), nearly one-third of consumers said an insurer’s recommendation decided where they took their car. About two-thirds decided on something else, such as past experience, friends and family, price, location or reviews.
And some drivers never file a claim. A LendingTree survey of 2,000 US consumers in June 2024 found 39% of insured drivers who had an accident or incident paid for repairs without filing a claim.
The jobs are worth winning. CCC put the average repair cost for a repairable vehicle at $4,818 in 2025, a preliminary figure. Our guide to growing without leaning on DRPs goes deeper on the doors you control.
How a driver picks a shop
Walk through the hours after a wreck. The car gets towed or limps home. The driver calls the insurer and may hear a recommended shop. Then, more often than not, they pick up the phone and search.
On a phone, “collision repair near me” shows paid ads, then a map with a short list of shops, then websites. The map listing shows your stars, your review count, your hours and a Call button. Many drivers call straight from it without opening a single website.
Google’s help page on local ranking says local results are mainly based on relevance, distance and prominence. It says complete and accurate information helps, that “more reviews and positive ratings can help your business’s local ranking,” and that there’s no way to pay for a better local ranking.
Reviews decide a lot of calls. BrightLocal’s 2026 Local Consumer Review Survey of 1,002 US adults found 97% of consumers read reviews for local businesses, and 74% look for reviews written in the last three months. 47% won’t use a business with fewer than 20 reviews.
Then the phone. Invoca’s 2025 B2C Buyer Experience Report, covering high-stakes purchases including automotive, found 44% of consumers now prefer calling a business for help, up from 32% in 2022. A driver who calls three shops books with the one that answers and offers a time.
So the path is short: show up, look trustworthy, answer, book. Marketing that skips any of those steps leaks.
The channels, ranked by intent
Not every channel reaches a driver at the same moment. Rank them by how close the person is to needing a repair right now.
| Channel | When it reaches the driver | Cost model | Speed | Best for |
|---|---|---|---|---|
| Google Business Profile (the map) | Searching after a wreck | Free, takes work | Weeks to months | Every shop, first |
| Google search ads | Searching after a wreck | Pay per click | Days | Filling bays now, specific repairs |
| Local Services Ads | Searching after a wreck | Pay per lead | Days, where available | Extra reach in some areas |
| Website and local SEO | Checking you out before calling | Work, not clicks | Months | Trust, and searches by repair type |
| Reviews | Choosing between shops | Free, takes habit | Steady | Winning the comparison |
| Referral partners | When a dealer, tow operator or agent is asked | Relationship time | Months | Steady, high-trust work |
| Facebook and Instagram | Not searching yet | Pay per impression | Days | Customer-pay work, retargeting |
A few notes on each:
- The map comes first because it’s free, it sits on the first screen of a phone search, and it feeds everything else. Our Google Business Profile guide covers it line by line.
- Search ads are the fastest way to reach drivers in the moment, and the easiest to waste if nobody prunes glass, mechanical and job-seeker searches. See Google Ads vs. local SEO for when each should lead.
- Local Services Ads list “Auto Body Shop” as a US category, but Google’s help pages say availability depends on your area, and businesses go through Google’s screening first.
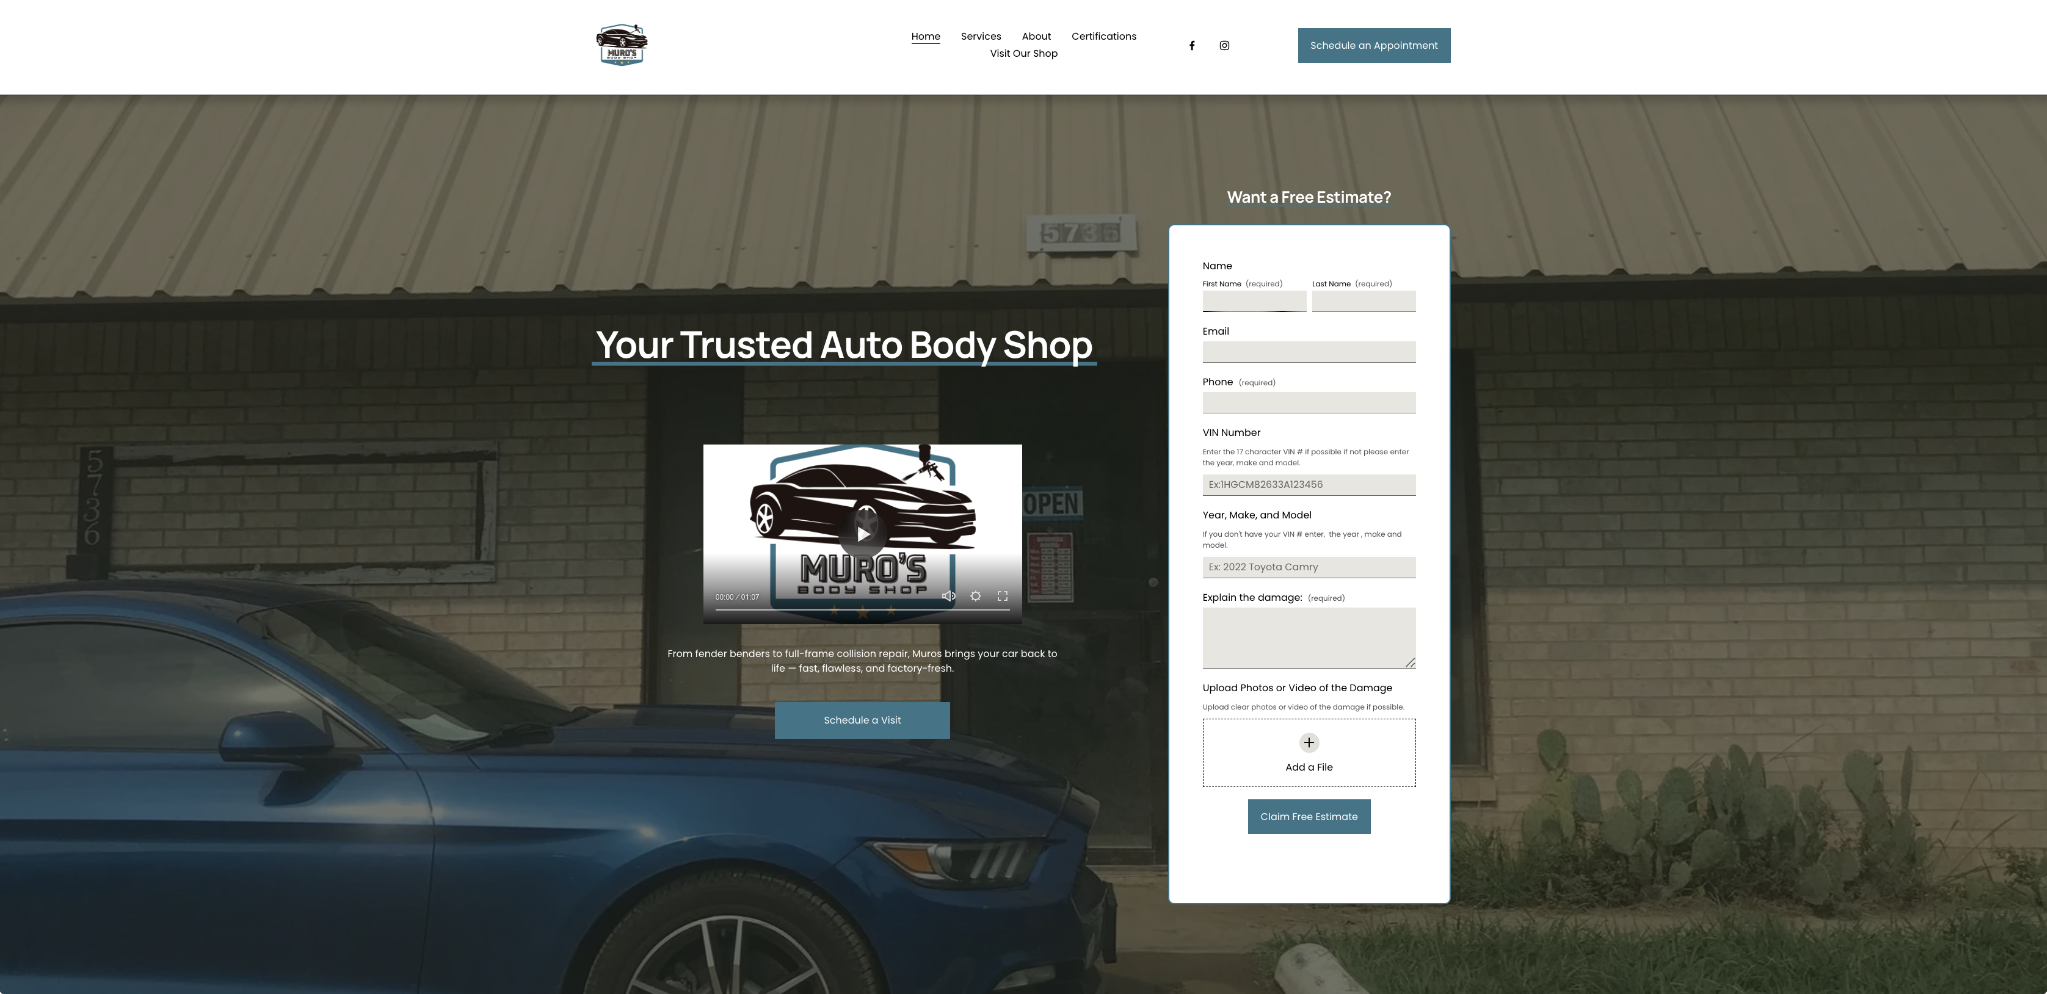
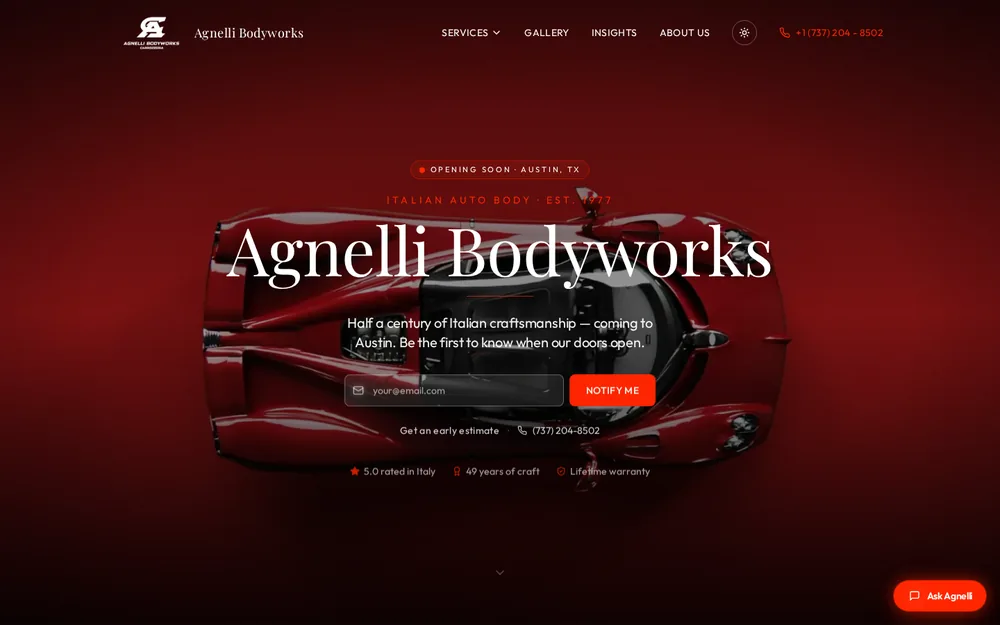
- The website is where a driver confirms you’re real: your building, your work, your reviews and how insurance works with you. Why body shop websites lose customers has a 10-minute test.
- Facebook can’t find the driver who wrecked this morning, but it can fill bays with customer-pay work. Google Ads vs. Facebook Ads explains the split.
Fix the leaks before buying traffic
More traffic into a broken process just buys more broken calls. Before you add budget, check the five places a job can die: demand, visibility, trust, response and booking.
Response is where most shops lose the cheapest jobs they’ll ever get. Harvard Business Review’s 2011 audit of 2,241 US companies found firms that tried to contact a lead within an hour were nearly 7 times as likely to qualify it as firms that waited even an hour longer. Only 37% responded within an hour, and 23% never responded.
The fixes are rarely expensive:
- One named person owns every new inquiry, with a backup for lunch and Saturdays.
- Missed calls roll to a second phone instead of voicemail.
- Web forms go to a person’s phone, not a shared inbox.
- Every call ends with an estimate time, not “call us back.”
- Every estimate gets a follow-up within one business day.
Our guide to getting more collision repair jobs walks through all five leaks with a scorecard, and the front desk phone script gives your team the exact words.
Budgets that follow your bays
There’s no right budget in the abstract. Work it backward: the extra cars you want and can fit, times a realistic cost per booked job, checked against the gross profit each RO leaves.
Monthly budget = extra jobs you can fit × the most you’ll pay to win one.
Benchmarks help you sanity-check costs, not set them. WordStream and LocaliQ’s Google Ads Benchmarks 2026 put the average cost per click at $4.35 and the average cost per lead at $29.96 for Automotive: Repair, Service & Parts. That category includes mechanics and parts sellers, and it stops at the lead. It can’t tell you what a booked collision job costs.
Your bays set the ceiling. A budget that buys more cars than your techs, booth and frame rack can turn builds a wait list and stretches cycle time. J.D. Power’s 2025 U.S. Auto Claims Satisfaction Study put average cycle time for repairable vehicles at 19.3 days. Push yours past that and the reviews follow.
The full method, with a worked table, is in how much a body shop should spend on Google Ads. The repair opportunity calculator runs it with your own numbers.
Measure it in repair orders
Tracking doesn’t need to be fancy. It needs to be consistent.
- Give each source its own tracked phone number: ads, the Google listing and the website.
- Track form submissions, and send each one to a named person’s phone.
- Make the RO source field required at check-in, with fixed choices.
- Count each job in the month the inquiry came in.
- Once a month, put spend, calls, answered and missed calls, estimates, booked jobs, repair revenue and cost per booked job on one page.
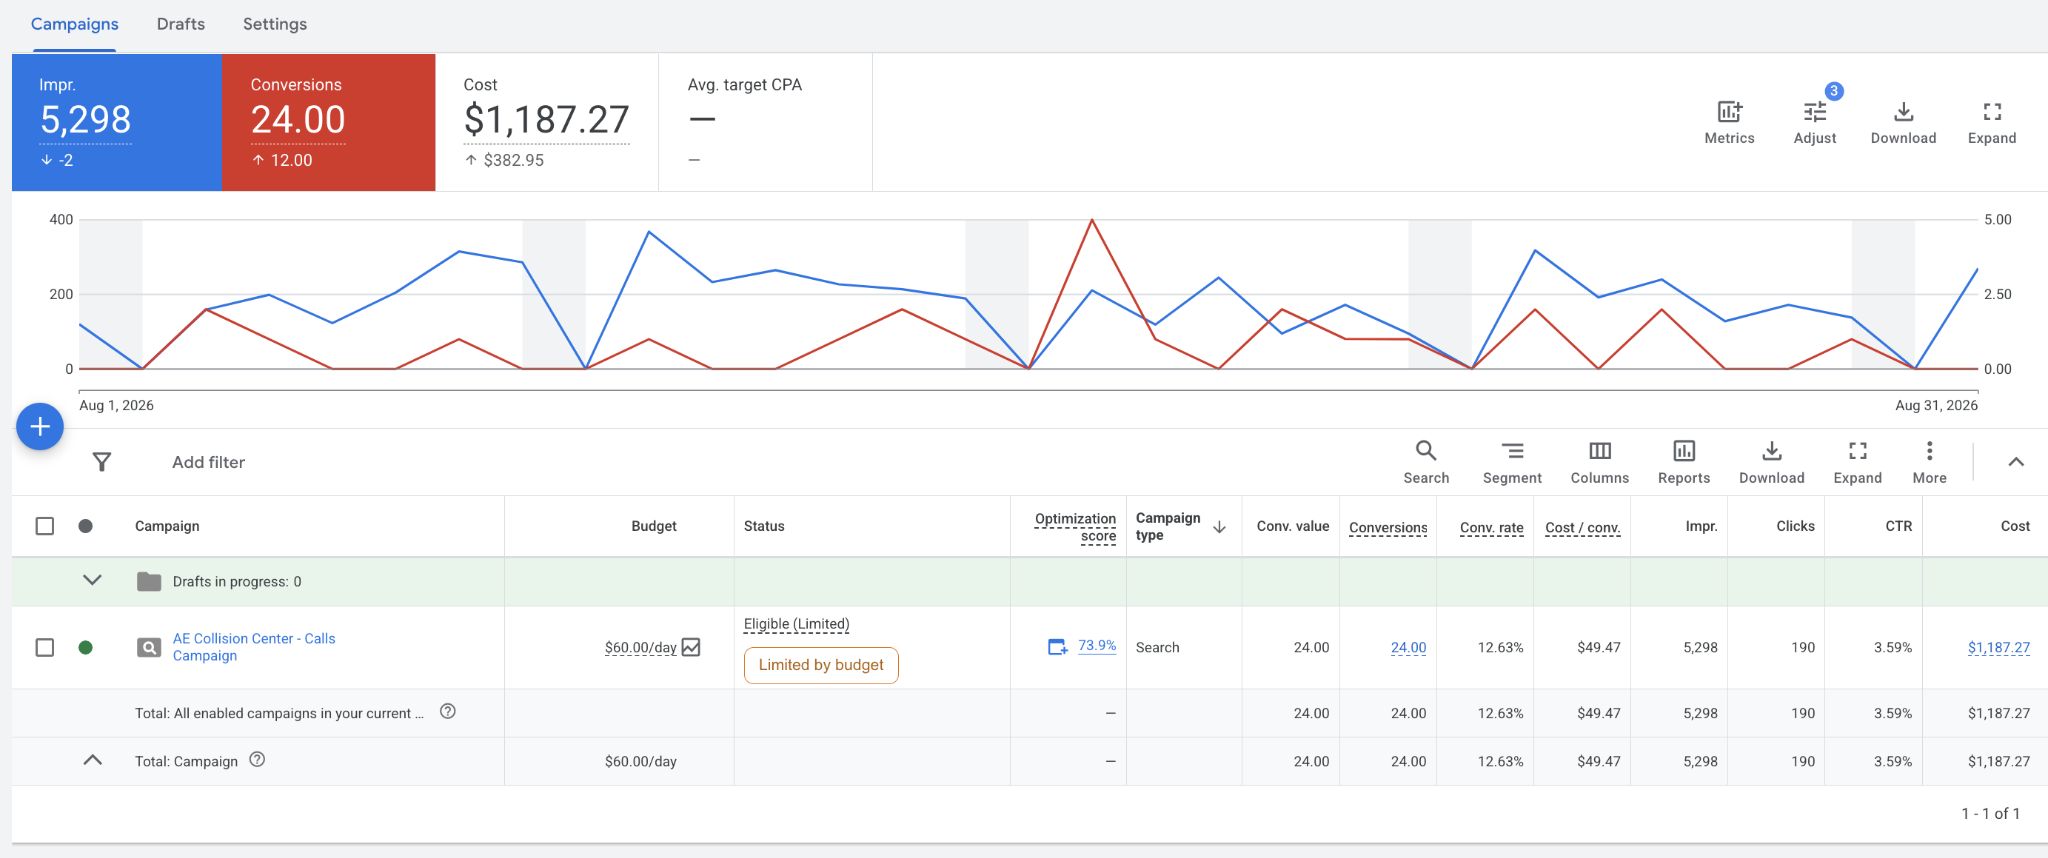
Here’s what that looks like with real numbers. AE Collision Center in Tampa was paying for ads without reliable call and form tracking, and the account attracted searches that didn’t fit the repairs the shop wanted. We rebuilt the campaign around local collision repair searches, corrected the tracking and built a website with real reviews and before-and-after repairs.
In August 2026, month one, the account spent $1,187.27 and recorded 24 tracked conversions. The shop reports 9 closed jobs and about $40,000 in repair revenue. That’s about $132 in ad spend per booked job, before our fee. In September, month two, the shop reports 15 new cars, $117K in repair revenue from Collision Catalyst jobs alone, and $54K take-home.
One shop, one market, and the shop’s own team answered the calls and closed the jobs. But it shows what tracking makes possible: the owner can count cars and dollars instead of guessing. We break down the math in what one booked job really cost a Tampa shop, and the account evidence is in the AE Collision Center case study.
Choosing who does the work
You can run this in-house, hire an agency, or work with a partner that’s paid on results. Whichever you choose, hold them to the same terms:
- Every account in the shop’s name: the ad account, the Google listing, analytics, the domain and the tracking numbers.
- Ad spend on your card, with the fee on its own line.
- A monthly report that starts with booked jobs and works back to spend.
- Month-to-month terms, or a short first term with a clean exit.
- Someone who knows what a supplement, a total loss and a DRP are without asking.
Watch for reports full of impressions and “engagement,” ads running in someone else’s account, and long contracts with cancellation fees. How to tell if your marketing agency is working has a 30-minute audit you can run yourself.
For the record, here’s how we work: one partner shop per city, no management fee until your first booked jobs (the target is written into the agreement), month-to-month, and you own everything. We also turn shops down when we can’t help.
A 90-day plan for any shop
- Days 1 to 14: get admin access to every account, set up tracked numbers, make the RO source field required, and fix the Google listing’s category, hours and photos.
- Days 15 to 30: fix the phones. Name an owner for every inquiry, set missed calls to roll over, and start asking every customer for a review at delivery.
- Days 31 to 60: fix the website’s first screen and estimate form, then launch tight search ads for the repairs you want, during the hours someone answers.
- Days 61 to 90: read the search terms weekly, cut what doesn’t book, compare cost per booked job by source, and move money only where the numbers and the bays allow.
The week-by-week version, with what a good partner should show you at each checkpoint, is in what to expect in the first 90 days.
If you’d rather have someone check your shop first, our free 20-minute shop review ends with the three fixes worth doing first, yours to keep even if we never work together.
Sources
- CCC: Crash Course 2026 report press release (2026)
- Autobody News: CCC Crash Course 2026 coverage, average repair cost (2026)
- Collision Repair Magazine: CCC repair trends, fewer claims and rising complexity reshape shop workloads (2026)
- Repairer Driven News: CCC report shows shift to DRP and AI appraisals (2026)
- Repairer Driven News: CCC Moments of Truth study coverage (2024)
- LendingTree: Insurance repairs survey (2024)
- Google: Tips to improve your local ranking on Google (2026)
- Google: Getting started with Local Services Ads, United States (2026)
- BrightLocal: Local Consumer Review Survey (2026)
- Invoca: B2C Buyer Experience Report (2025)
- Harvard Business Review: The Short Life of Online Sales Leads (2011)
- WordStream: Google Ads Benchmarks 2026 (2026)
- J.D. Power: 2025 U.S. Auto Claims Satisfaction Study (2025)